User guide
Administration
Manage analyzer template
Energy SOAR will display the analysis summary the same way for all analyzers: display a tag using taxonomies and level color.
List analyzer templates
The management page can be accessed from the header menu under Admin organization > Analyzer templates and requires the manageAnalyzerTemplate permission (see Profiles and Permissions).
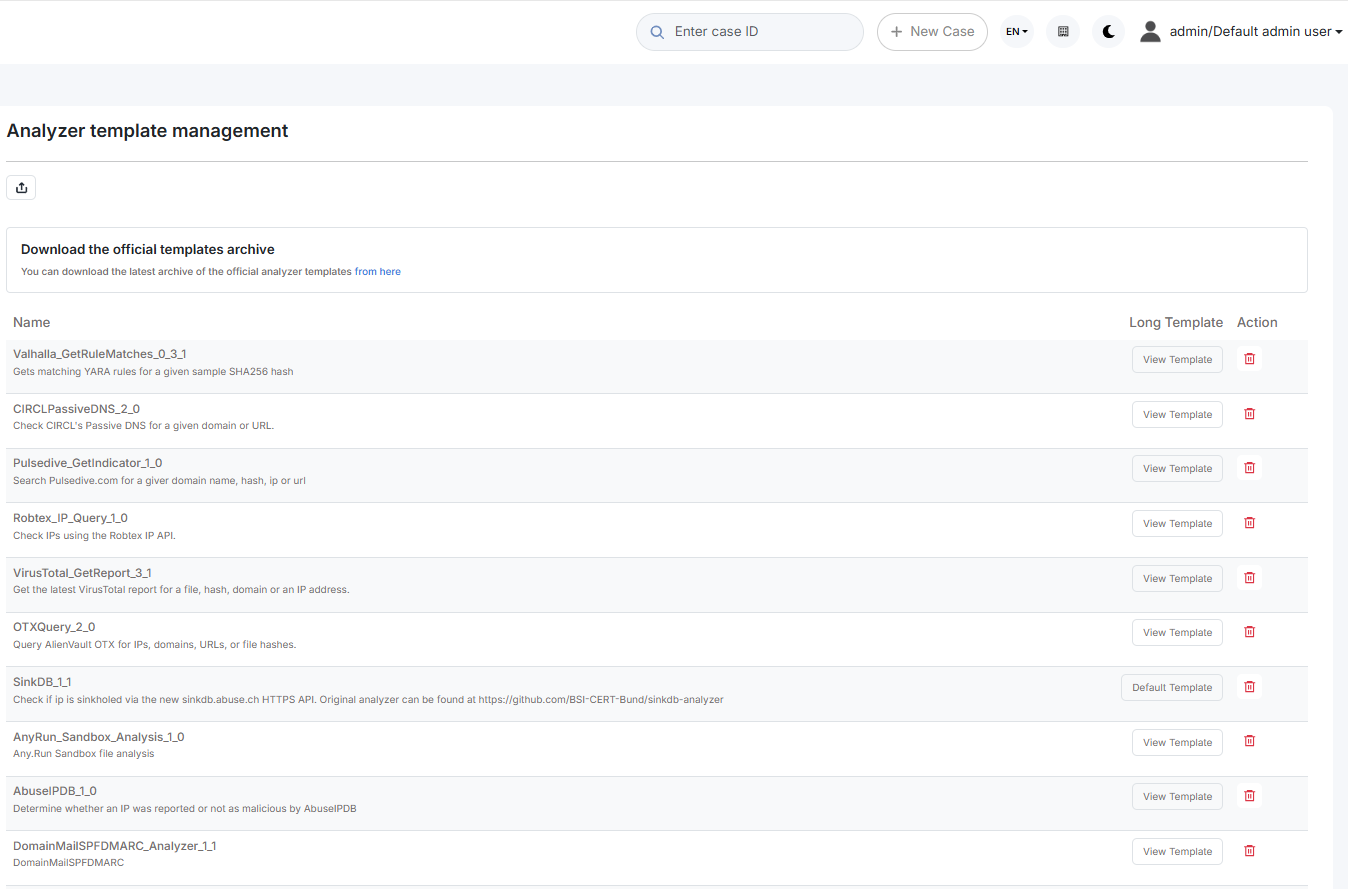
Analyzer templates are still customisable via the UI and can also be imported.
User Profiles management
Permissions
A Profile is a set of permissions attached to a User and an Organisation. It defines what the user can do on an object hold by the organisation. Energy SOAR has a finite list of permissions:
manageOrganisation (1) : the user can create, update an organisation
manageConfig (1): the user can update configuration
manageProfile (1): the user can create, update and delete profiles
manageTag (1): the user can create, update and delete tags
manageCustomField (1): the user can create, update and delete custom fields
manageCase: the user can create, update and delete cases
manageObservable: the user can create, update and delete observables
manageAlert: the user can create, update and import alerts
manageUser: the user can create, update and delete users
manageCaseTemplate: the user can create, update and delete case template
manageTask: the user can create, update and delete tasks
manageShare: the user can share case, task and observable with other organisation
manageAnalyse (2): the user can execute analyse
manageAction (2): the user can execute actions
manageAnalyzerTemplate (2): the user can create, update and delete analyzer template (previously named report template)
manageWorkflows: the user can create, update and delete workflows
listWorkflows: the user can see a list of workflows
viewWorkflows: the user can see workflow details
manageReports: the user can create, update and delete reports
listReports: the user can see a list of reports
(1) Organisations, configuration, profiles and tags are global objects. The related permissions are effective only on “admin” organisation. (2) Actions, analysis and template is available only if Energy SOAR Automation connector is enabled
NOTE
Read information doesn’t require specific permission. By default, users in an organisation can see all data shared with that organisation (cf. shares, discussed in Organisations,Users and sharing).
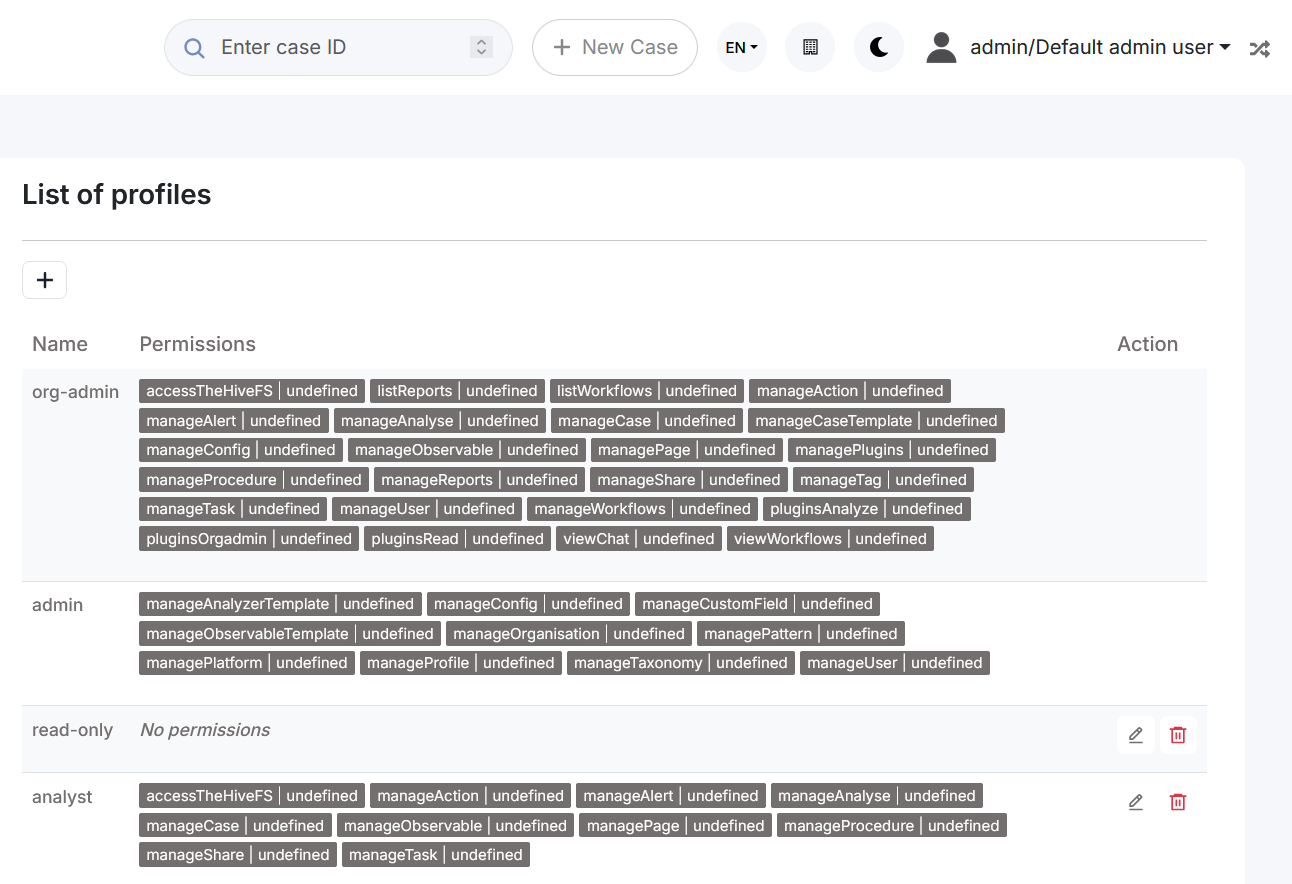
Profiles
We distinguish two types of profiles:
Administration Profiles
Organisation Profiles
The management page is accessible from the header menu through the Admin > Profiles menu and required a use with the manageProfile permission (refer to the section above).
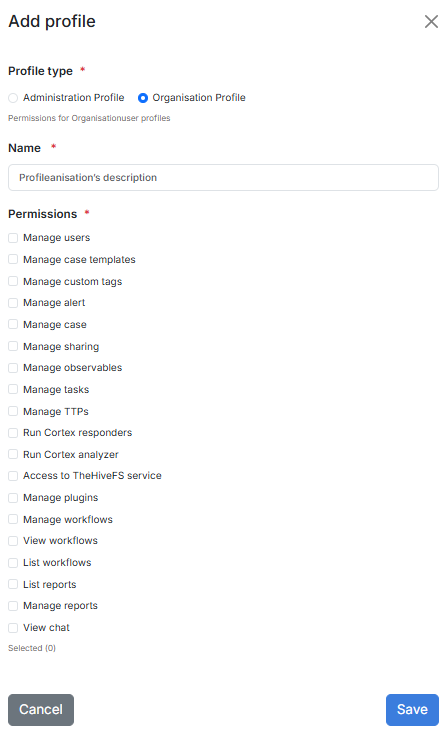
Energy SOAR comes with default profiles but they can be updated and removed (if not used). New profiles can be created.
Once the New Profile button is clicked, a dialog is opened asking for the profile type, a name for the profile and a selection of permissions. Multiple selection can be made using CTRL+click.
If it is used, a profile can’t be remove but can be updated.
Default profiles are:
admin: can manage all global objects and users. Can’t create case.
analyst: can manage cases and other related objects (observables, tasks, …), including shring them
org-admin: all permissions except those related to global objects
read-only: no permission
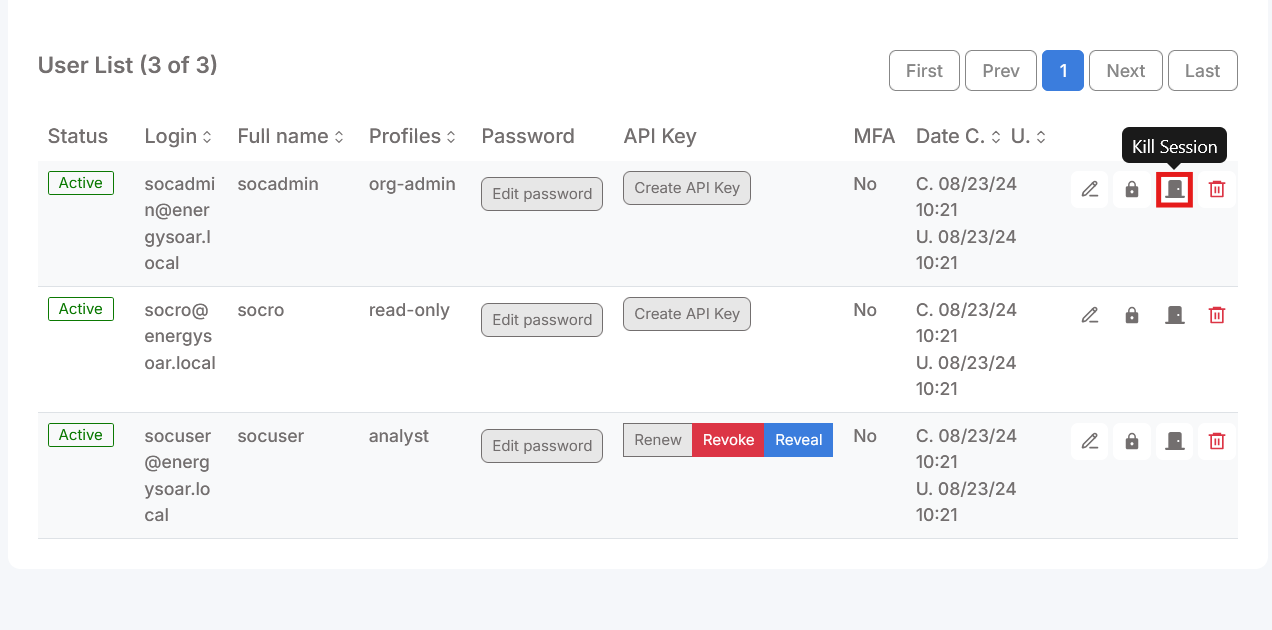
Kill user session
Everytime you can manage logged user sessions as admin user. In organizations administration page you can kill user session. This user will be immediatelly logout.
Select user organization
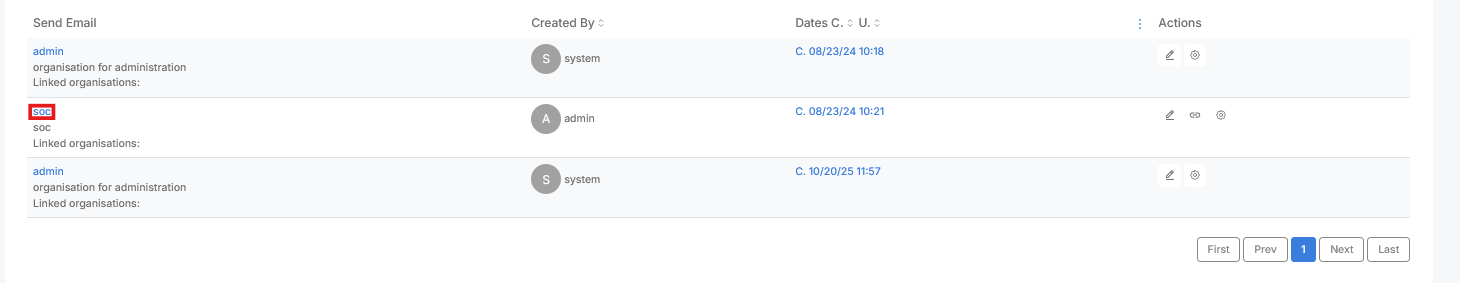
And click “Kill session” button.
Log management
Energy SOAR stores its logs under the /var/log/energysoar/ directory.
The following log categories are available (all files are .log):
applicationauditingn8n
Log rotation is enabled, with a maximum size of 10 MB per log file.
Configuration of log files can be accessed in /etc/energysoar/logback.xml file.
Reports
Create and edit
Go to Reports on top menu
Click Create new report on the left
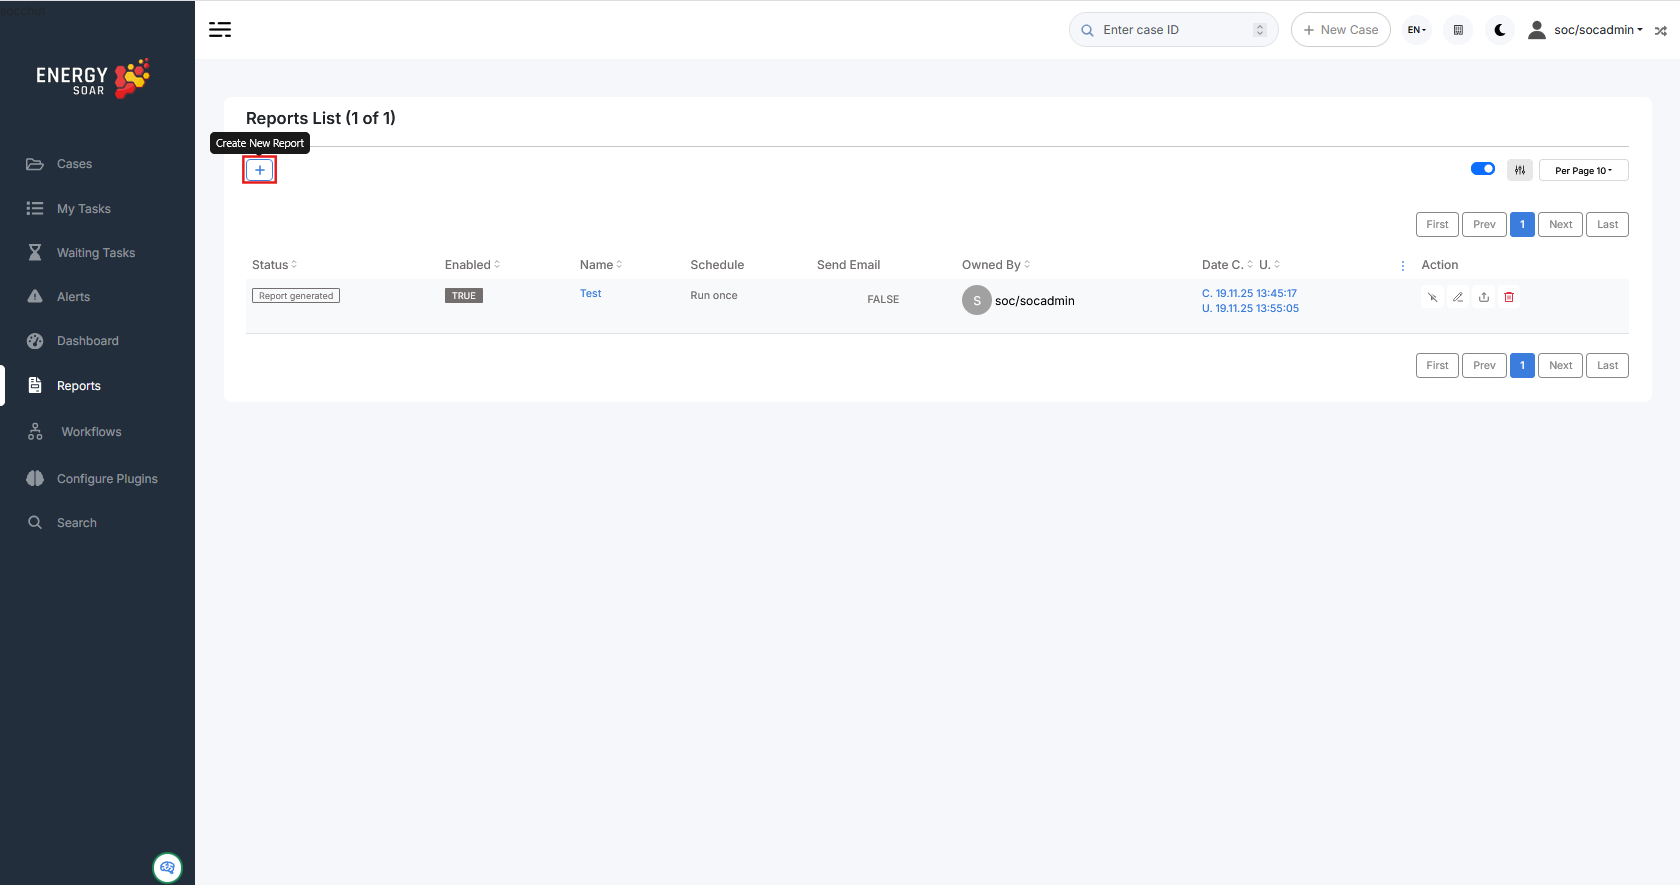
Now you can see New Report view.
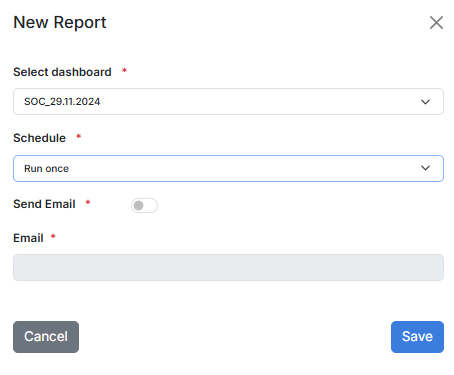
Select dashboard: there you should select exising dashboard.
Schedule types:
Run once
Daily
Weekly
Montly
Cron format (UNIX cron format)
Send Email: select if you would like to recive report on e-mail.
List
On reports list you see all created reports.

Reports statuses:
Created: Going to create the report
Generated: Report was generated and you can download or it was sent
Error: An error occurs. Please check logs
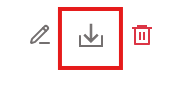
Actions:
Enable/Disable
Edit
Download
Delete
Cases
Case Preview
When you click on a case in the Cases section, a Case Preview window opens displaying comprehensive information about the case organized in several tabs.
Details Tab
The Details tab shows the basic case information including:
Case title and identifier
Case status
Severity level
TLP (Traffic Light Protocol)
Description of the incident
Related Cases - linked cases that are connected to the current case
This tab provides a quick overview of the case’s key information and context.
Tasks Tab
The Tasks tab displays a comprehensive list of all tasks associated with the case, organized by their status:
Pending Tasks - Plan of Action
Tasks that have been planned but not yet started
Represent the planned response actions for the incident
In Progress Tasks
Tasks currently being executed
Show real-time progress of ongoing incident response activities
Completed Tasks - Situation Report
Tasks that have been finished
Include results and findings from completed investigations and actions
Provide a report of what has been accomplished so far
For each task, the tab displays:
Task title and description
Task status
Assigned personnel
Task results and findings
Observables Tab
The Observables tab shows all artifacts collected and added to the case, such as:
IP addresses
Hostnames
Email addresses
File hashes
URLs
Other artifacts
For each observable, the tab also displays:
Analysis results from ran analyzers
Tags and TLP classification
Related information from external sources
TTPs Tab
The TTPs (Tactics, Techniques & Procedures) tab displays:
MITRE ATT&CK framework mapping
Associated tactics used in the incident
Specific techniques identified
Procedure details related to the attack chain
This helps contextualize the incident within known adversary behaviors.
Observables
Observables are pieces of information added to a case.
| autonomous-system | fqdn | registry | |
| domain | hash | mail-subject | uri_path |
| file | hostname | other | url |
| filename | ip | regexp | user-agent |
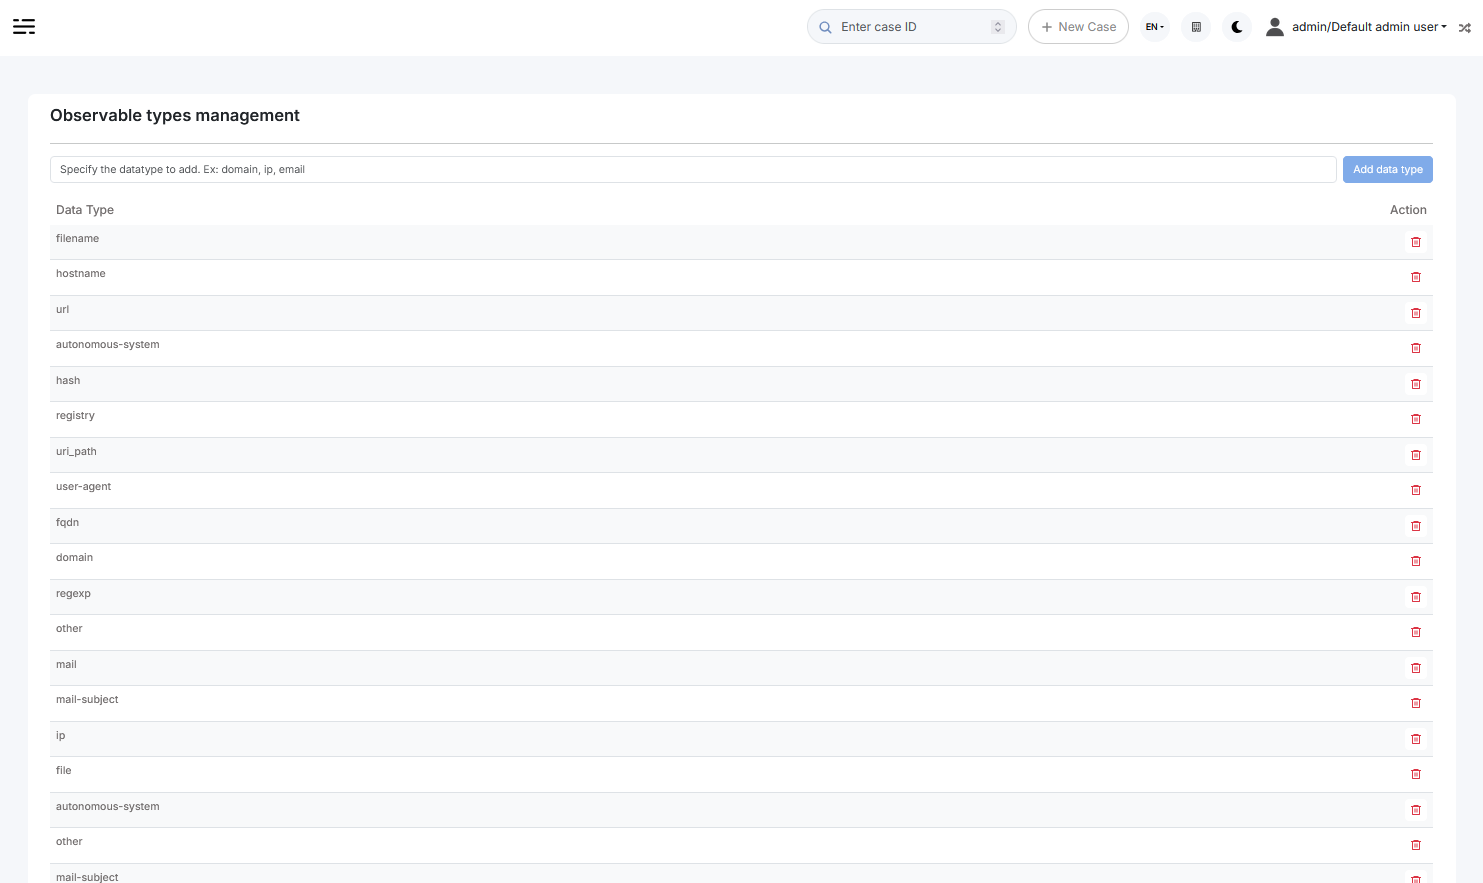
Observable types
You can edit observable types in the administrator panel.
Admin > Observable
How to add observables into Case
Perform the following steps to add an observable:
Click Add observable(s) button:
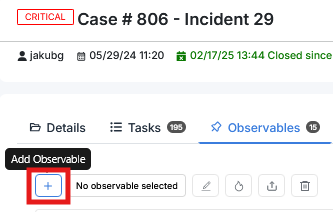
Create new observable(s) window appears:
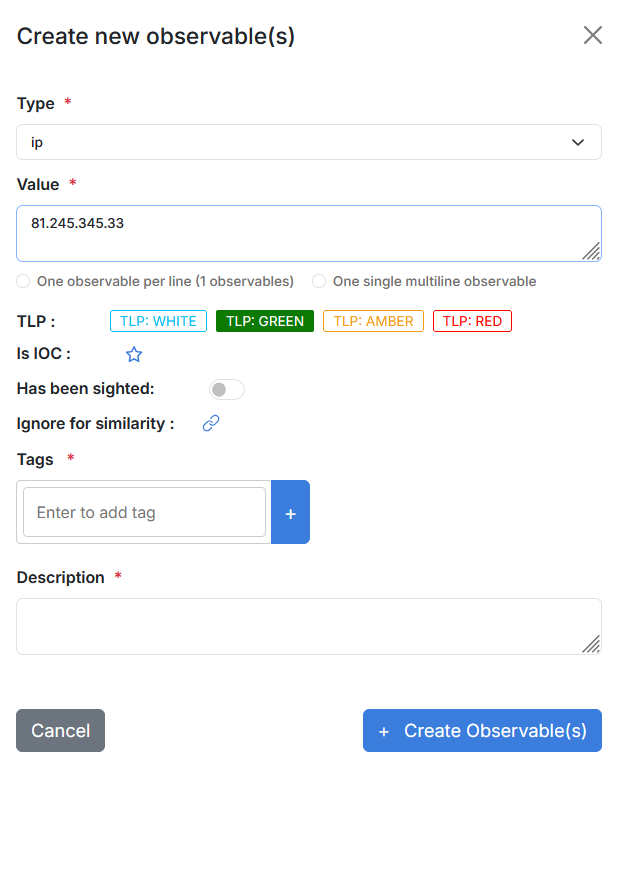
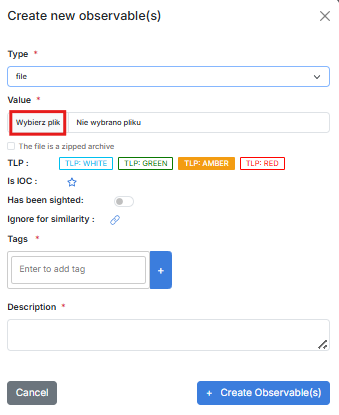
Select type e.g. ip, domain, url, mail. If you choose file type, you can upload a file. Zipped archives are supported.
You can add one single observables or many observables at once - one observable per line.
Select appropriate TLP flag.
(Optional) IOC flag indicates observables classified as True Positive. Only IOC-flagged observables are exported to MISP instances.
(Optional) You can also set “Has been sighted” toggle to mark observables which have been seen.
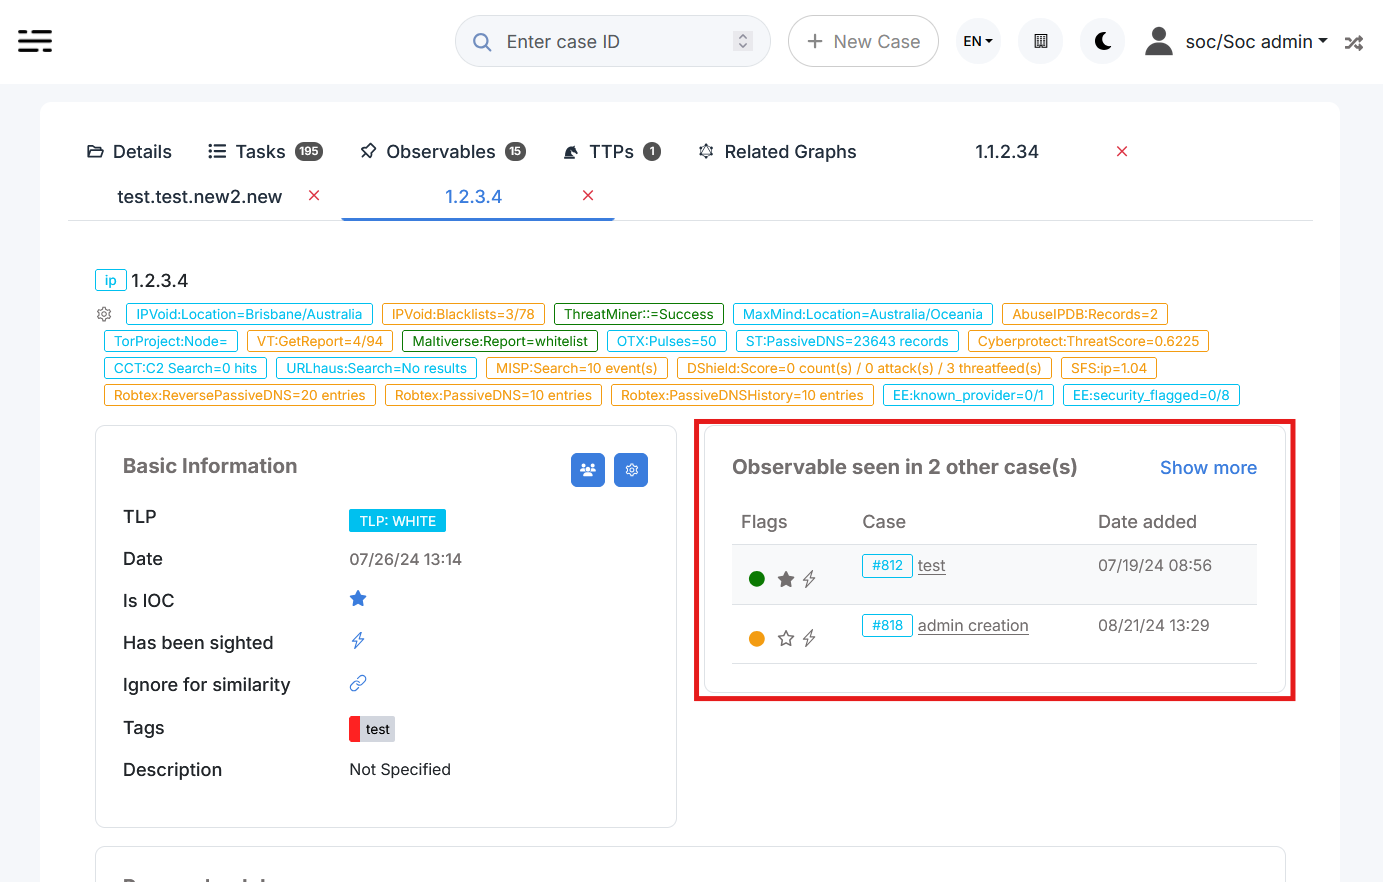
(Optional) If you click “Ignore for similarity”, you will disable “Observable seen in other cases” list.
Add tags and/or description.
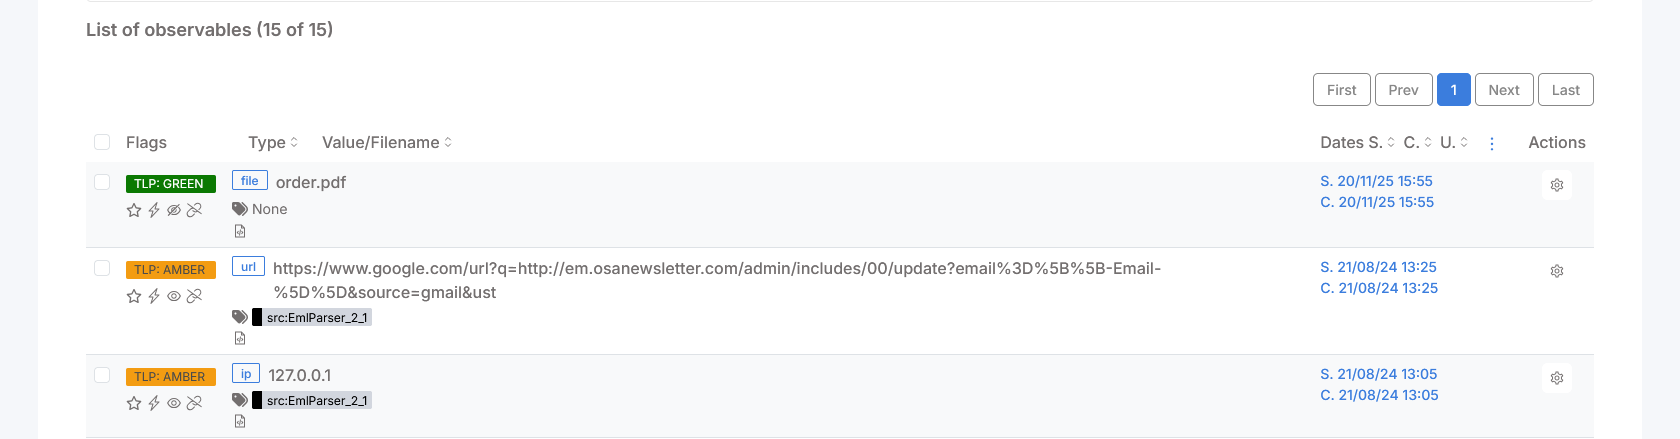
Click Create observable(s). On Observable List you can check if observables have been seen in other cases:
Black eye: Observable seen in other cases,
Red eye: Observable seen in other cases and flagged as IOC there.
You can display details and check cases where the observable has been seen:
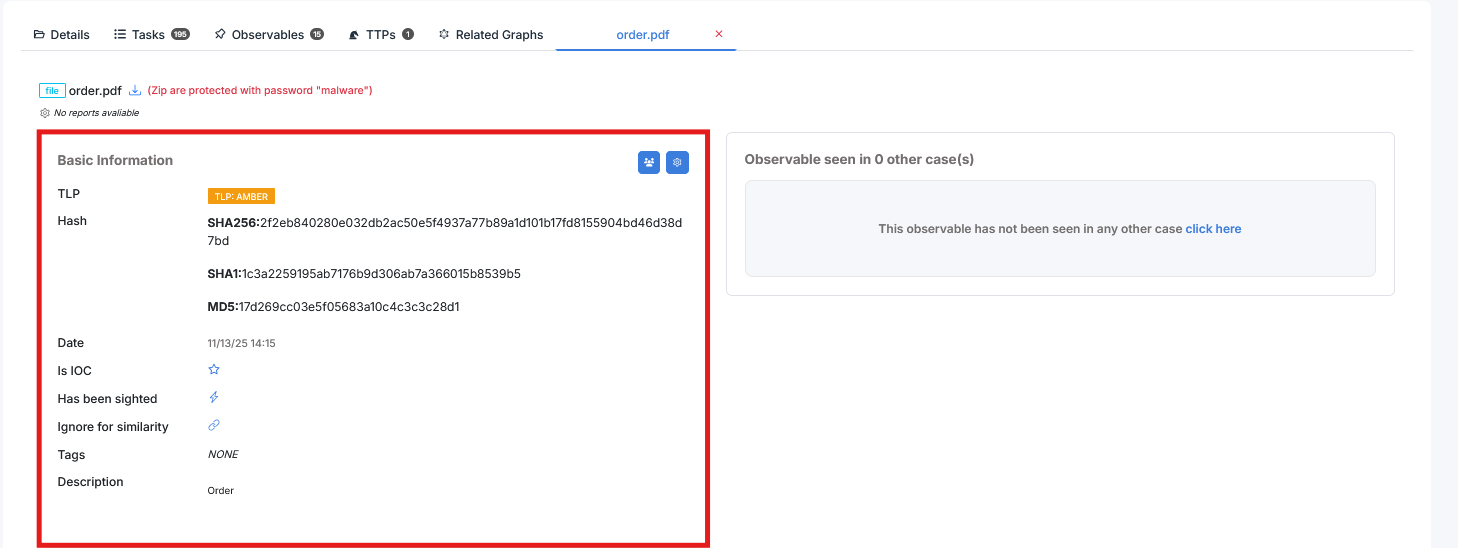
After uploading file-type observables hashes are automatically calculated:
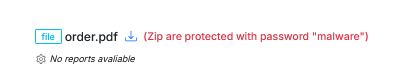
If you want to download file observable, it will be zipped and password protected:
You can run various analyzers (e.g. VirusTotal, MaxMind_GeoIP) and responders (e.g. block IP, domain, e-mail) against observables.
Case Templates
Some cases may share the same structure (customfields, tags, tasks, description, …). Templates are here to automatically add tasks, description, metrics and custom fields while creating a new case. A user can choose to create an empty case or based on a registered template.
List case templates
The management of the case templates is accessible through the menu Organisation > Case Templates . To manage them your profile must have the permission ‘manageCaseTemplate’.
Create or upload template
Create a case template
In the case templates management page, clic the New template button (Organisation > Case Templates > New Template).
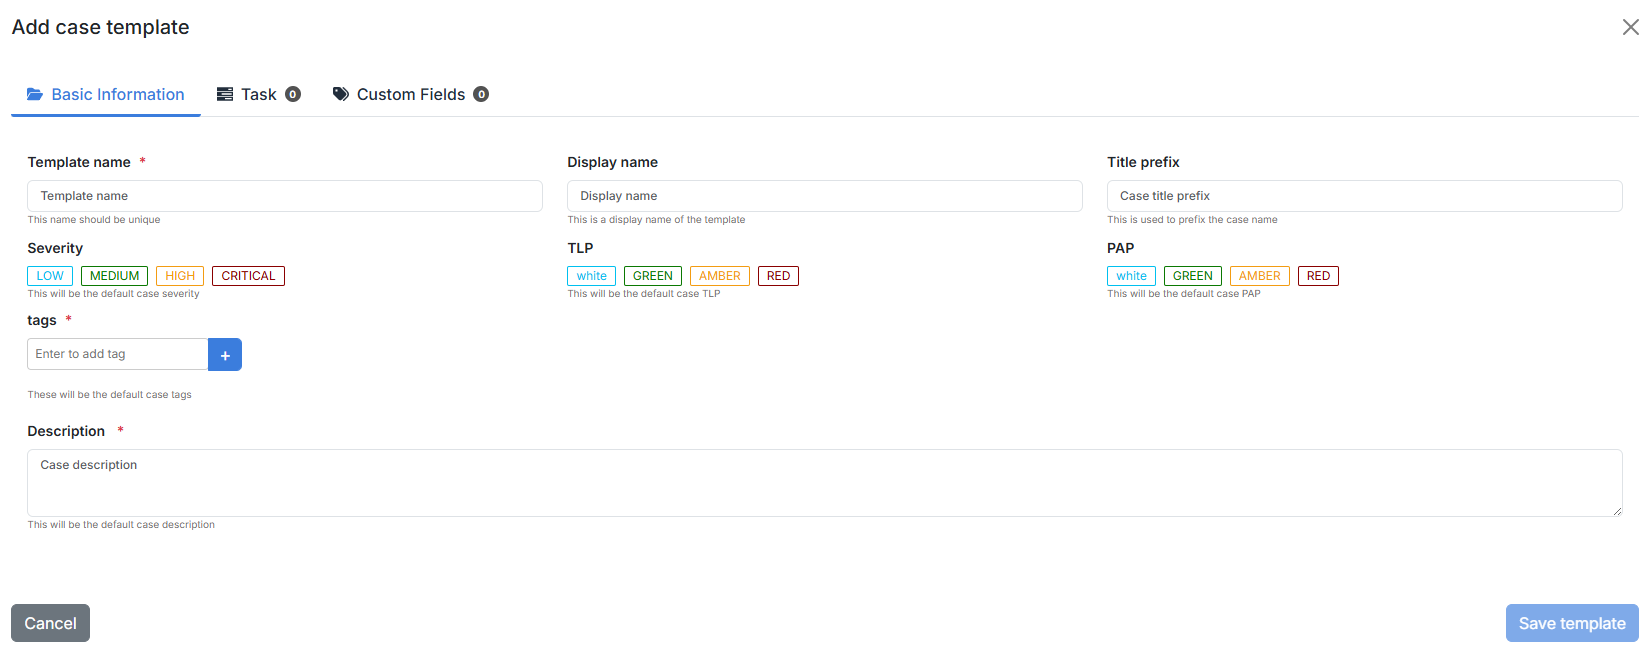
In the case template you can set:
Title prefix
Severity
TLP/PAP
Tags
Description
Tasks
Customfields
Two fields are mandatory:
Template name (should be unique)
Description
Import a case template
You can also import your case template using a file in JSON format by clicking on the Import template button (Organisation > Case templates > Import template)
Edit a case template
To edit a case template, open the case template list and clic the edit button on the actions column (Organisation > Case Templates > Edit).

Export a case template
To export a case template, open the case template list and clic the export button on the actions column (Organisation > Case Templates > Export).
Delete a case template
To delete a case template, open the case template list and clic the export button on the actions column (Organisation > Case Templates > Export).

Case Template list
Suspicious User Activity
User authentication from multiple devices
Data Theft
Mass deleting files or folders
Malware
Admin creation
Unauthorized Access
Denial of Service (DoS)
Short-lived account
Suspicious VPN connection
Suspicious e-mail
Suspicious Network Activity
IRM-5-MaliciousNetworkBehaviour
Vulnerability
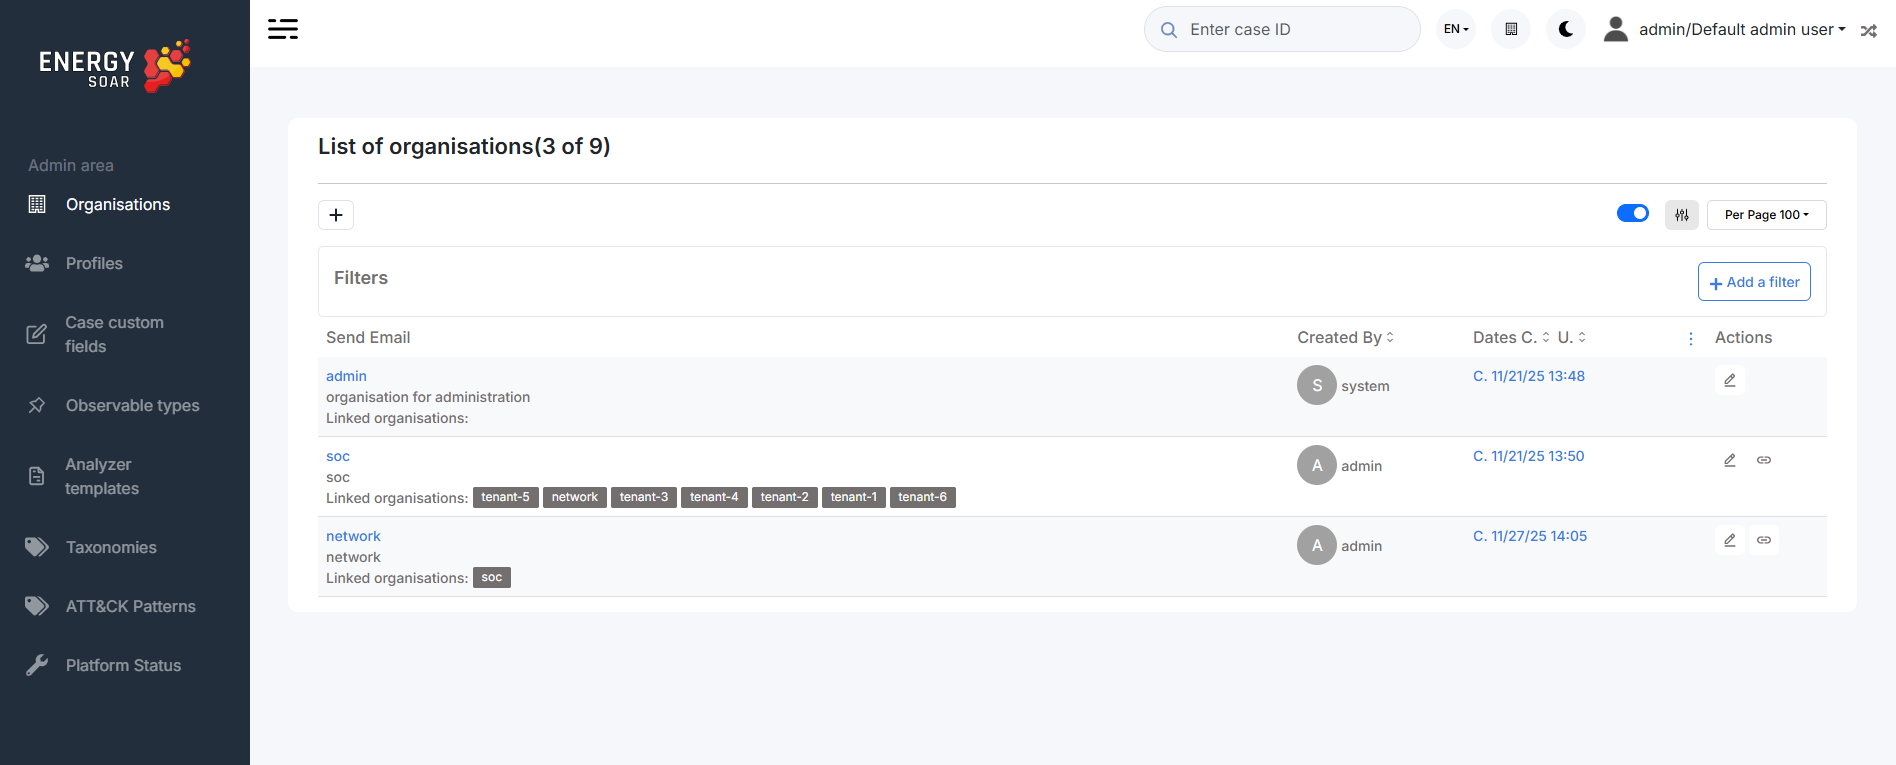
Organization
Organization allows using a single instance of EnergySOAR with separation among clients.
Multi-tenancy in EnergySOAR enables a single instance of the platform to support multiple organizations, each operating independently.
Every organization has its own set of users, roles, cases, alerts, and analyzers, ensuring that data and workflows remain isolated. This separation allows organizations to collaborate securely within the same system without risking unauthorized access to other organizations’ information. Administrators can centrally manage the instance while maintaining strict boundaries between tenants, simplifying both operational oversight and compliance with data privacy requirements.
A user in EnergySOAR can belong to multiple organizations, allowing them to access and contribute to different tenants within the same instance. Users can easily switch between organizations without needing to log out, with their permissions and data access automatically adjusted for each tenant.
This flexibility enables administrators and analysts to collaborate across multiple organizations while maintaining strict separation of cases, alerts, and other sensitive information.
User
In EnergySOAR, a user is a member of one or more organisations. One user has a profile for each organisation and can have different profiles for different organisations. For example:
“analyst” in “organisationA”;
and “admin” in “organisationB”;
and “read-only” in “organisationC”.
Organization and Case sharing
EnergySOAR comes with a default organisation named “admin” and is dedicated to users with administrator permissions of EnergySOAR instance. This organisation is very specific so that it can manage global objects and cannot contain cases or any other related elements.
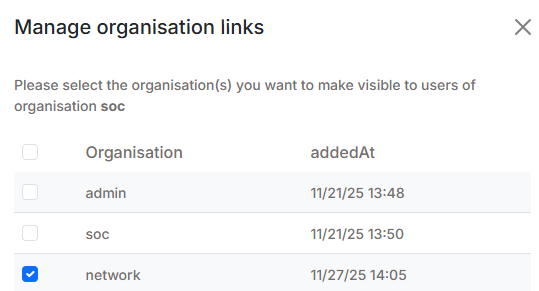
By default, organisations can’t see each other, and can’t share with any. To do so, an organisation must be “linked” with another one. Only super administrators or users with manageOrganisation permissions can give the ability of a organisation to see an other one. This ability named “link” is unidirectional.
To share a case with another organisation, a user must be able to see it: its organisation must be “linked” with the targeted organisation.
Share and effective permissions
When a user creates a case, the case is linked to the user’s organisation with the profile “org-admin”. It means that there is no restriction, the effective permissions are the permissions the user has in his organisation.
If he decides to share that case with another organisation, he must choose the profile applied on that share.
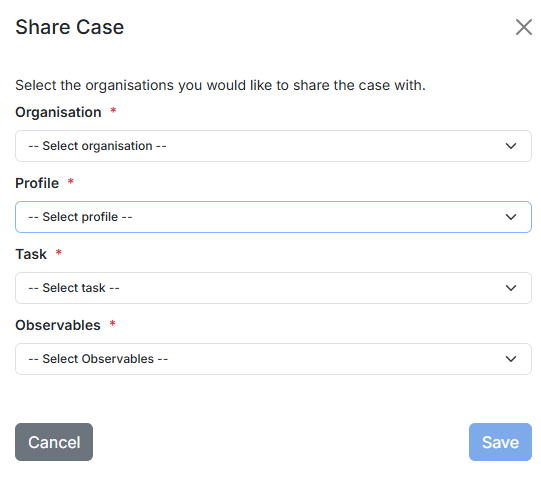
To exerce a action on a case, the related permission must be present in the user profile and in the case share.
When you share a case, you can share its tasks or observables but it is not mandatory. Tasks (and observables) can be unitary shared.
They can be shared only with organisations for which case is already shared. A case can be shared only once for a given organisation. Thus a case an its tasks/observables are shared with the same permissions for the same organisation.
#### Custom Tags
custom tags are tags manually created (out of libraries).
You must have the permission manageTag on your profile to manage custom tags.
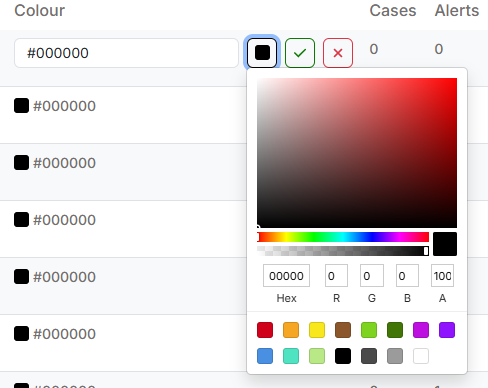
Modify a custom-tag border colour
You can modify your custom tags border colours.
In the custom tags list (Organization > Custom tags), in the Colour column, clic on the square or colour code value to modify it. This will apply to all cases, alerts and observables that contains the tag.
Delete a custom tag
You can also delete a custom tag.
In the custom tags list (Organization > Custom tags), in the Actions column, clic on the delete button
Workflows
SOC analysts have to handle many repetitive tasks. With Energy SOAR you can build workflows to automatically execute all relevant actions.
Workflows helps you to interconnect different apps with an API with each other to share and manipulate its data without a single line of code. It is an easy to use, user-friendly and highly customizable module, which uses an intuitive user interface for you to design your unique scenarios very fast. A workflow is a collection of nodes connected together to automate a process. A workflow can be started manually (with the Start node) or by Trigger nodes. When a workflow is started, it executes all the active and connected nodes. The workflow execution ends when all the nodes have processed their data. You can view your workflow executions in the Execution log, which can be helpful for debugging.

Activating a workflow Workflows that start with a Trigger node or a Webhook node need to be activated in order to be executed. This is done via the Active toggle in the Workflow UI. Active workflows enable the Trigger and Webhook nodes to receive data whenever a condition is met (e.g., Monday at 10:00, an update in a Trello board) and in turn trigger the workflow execution. All the newly created workflows are deactivated by default.
Sharing a workflow
Workflows are saved in JSON format. You can export your workflows as JSON files or import JSON files into your system. You can export a workflow as a JSON file in two ways:
Download: Click the Download button under the Workflow menu in the sidebar. This will download the workflow as a JSON file.
Copy-Paste: Select all the workflow nodes in the Workflow UI, copy them (Ctrl + c), then paste them (Ctrl + v) in your desired file. You can import JSON files as workflows in two ways:
Import: Click Import from File or Import from URL under the Workflow menu in the sidebar and select the JSON file or paste the link to a workflow.
Copy-Paste: Copy the JSON workflow to the clipboard (Ctrl + c) and paste it (Ctrl + v) into the Workflow UI.
Workflow export and migration
Workflow management options are available in the Organization settings, next to the section Case Template configuration (Organisation > Workflows).
From this view, workflows can be organized into logical groups that reflect operational structure — for example, by incident type, team, or environment stage. Each group can be reviewed, exported, or imported independently, enabling consistent packaging of related playbooks.
The following operations are supported:
Bulk export — select multiple workflows and export them as a single archive, preserving folder structure and workflow definitions
Individual export — export a single workflow as a JSON file for versioning or review
Import — upload workflow definitions from file, restoring them into the current organization
Environment migration — move playbook sets between test and production instances directly from the WebUI, without manual file handling
This allows teams to maintain a library of reusable playbook sets that can be versioned, transferred between environments, and re-imported in a repeatable and auditable way.
Workflow settings
On each workflow, it is possible to set some custom settings and overwrite some of the global default settings from the Workflow > Settings menu.
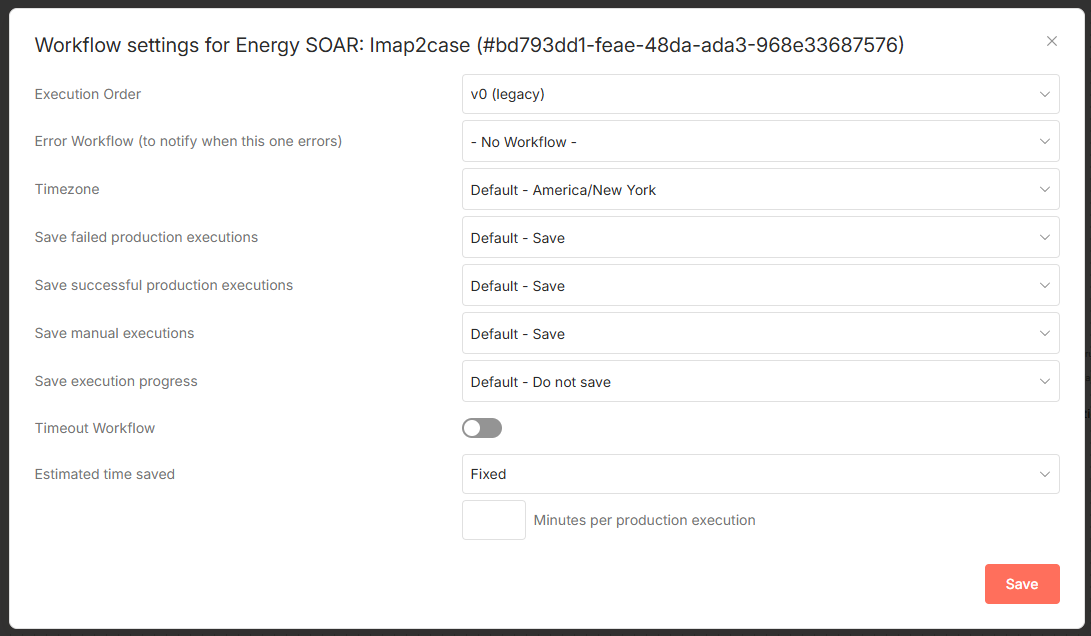
The following settings are available:
Error Workflow: Select a workflow to trigger if the current workflow fails.
Timezone: Sets the timezone to be used in the workflow. The Timezone setting is particularly important for the Cron Trigger node.
Save Data Error Execution: If the execution data of the workflow should be saved when the workflow fails.
Save Data Success Execution: If the execution data of the workflow should be saved when the workflow succeeds.
Save Manual Executions: If executions started from the Workflow UI should be saved.
Save Execution Progress: If the execution data of each node should be saved. If set to “Yes”, the workflow resumes from where it stopped in case of an error. However, this might increase latency.
Timeout Workflow: Toggle to enable setting a duration after which the current workflow execution should be cancelled.
Timeout After: Only available when Timeout Workflow is enabled. Set the time in hours, minutes, and seconds after which the workflow should timeout.
Failed workflows
If your workflow execution fails, you can retry the execution. To retry a failed workflow:
Open the Executions list from the sidebar.
For the workflow execution you want to retry, click on the refresh icon under the Status column.
Select either of the following options to retry the execution:
Retry with currently saved workflow: Once you make changes to your workflow, you can select this option to execute the workflow with the previous execution data.
Retry with original workflow: If you want to retry the execution without making changes to your workflow, you can select this option to retry the execution with the previous execution data.
You can also use the Error Trigger node, which triggers a workflow when another workflow has an error. Once a workflow fails, this node gets details about the failed workflow and the errors.
Connection
A connection establishes a link between nodes to route data through the workflow. A connection between two nodes passes data from one node’s output to another node’s input. Each node can have one or multiple connections.
To create a connection between two nodes, click on the grey dot on the right side of the node and slide the arrow to the grey rectangle on the left side of the following node.
Example
An IF node has two connections to different nodes: one for when the statement is true and one for when the statement is false.

Workflows List
This section includes the operations for creating and editing workflows.
New: Create a new workflow
Open: Open the list of saved workflows
Save: Save changes to the current workflow
Save As: Save the current workflow under a new name
Rename: Rename the current workflow
Delete: Delete the current workflow
Download: Download the current workflow as a JSON file
Import from URL: Import a workflow from a URL
Import from File: Import a workflow from a local file
Settings: View and change the settings of the current workflow
Credentials
This section includes the operations for creating credentials.
Credentials are private pieces of information issued by apps/services to authenticate you as a user and allow you to connect and share information between the app/service and the n8n node.
New: Create new credentials
Open: Open the list of saved credentials
Executions
This section includes information about your workflow executions, each completed run of a workflow.
You can enabling logging of your failed, successful, and/or manually selected workflows using the Workflow > Settings page.
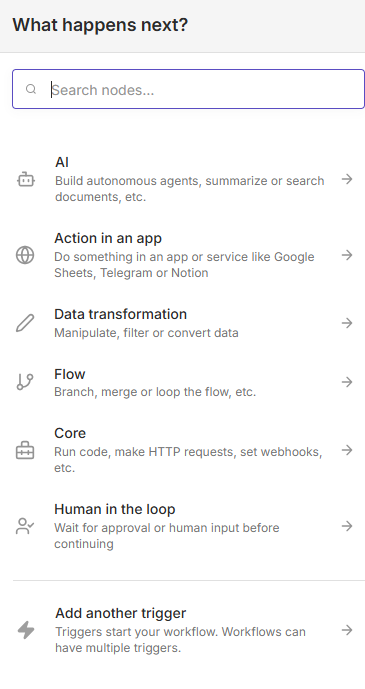
Node
A node is an entry point for retrieving data, a function to process data, or an exit for sending data. The data process performed by nodes can include filtering, recomposing, and changing data.
There may be one or several nodes for your API, service, or app. By connecting multiple nodes, you can create simple and complex workflows. When you add a node to the Editor UI, the node is automatically activated and requires you to configure it (by adding credentials, selecting operations, writing expressions, etc.).
There are three types of nodes:
Core Nodes
Regular Nodes
Trigger Nodes
Nodes are the building blocks of workflows. They are an entry point for retrieving data, a function to process data, or an exit for sending data. The data process includes filtering, recomposing, and changing data. Connect multiple nodes to create complex workflows.
For a complete list of available integrations, including:
Actions (App) nodes - 270+ integrations with external services like Slack, Google Drive, GitHub, and more
Core nodes - Essential workflow building blocks for logic, data transformation, HTTP requests, and scheduling
Trigger nodes - 80+ event-based workflow starters that listen for changes in external services
Credentials - 300+ authentication configurations for all integrations
Cluster nodes - Advanced AI and LangChain integrations for building complex AI workflows
Community nodes - Nodes contributed by the community
Create your own node - Build a custom node for your specific needs
Built-in App Nodes
Built-in Core Nodes
Built-in Trigger Nodes
Community Nodes
Built-in Credentials
Built-in Cluster Nodes
Create Your Own Node
Rate Limits
Advanced AI
Glossary
Core nodes
Core nodes are functions or services that can be used to control how workflows are run or to provide generic API support.
Use the Start node when you want to manually trigger the workflow with the Execute Workflow button at the bottom of the Editor UI. This way of starting the workflow is useful when creating and testing new workflows.
If an application you need does not have a dedicated Node yet, you can access the data by using the HTTP Request node or the Webhook node. You can also read about creating nodes and make a node for your desired application.
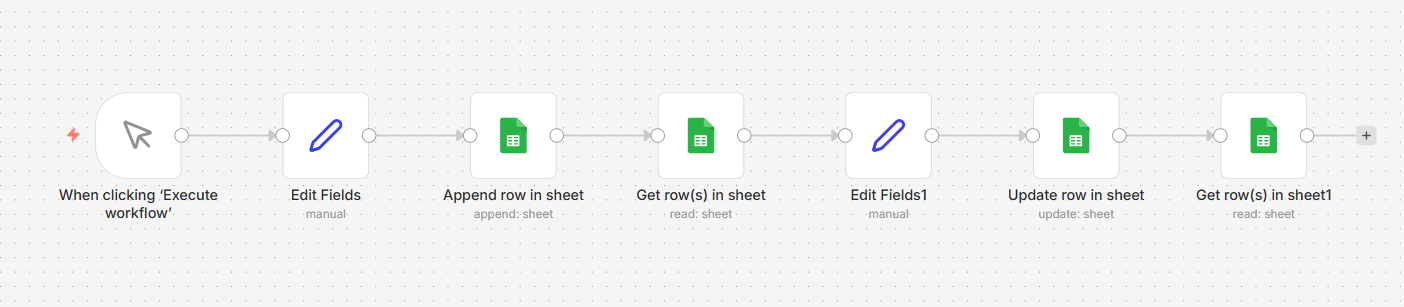
Regular nodes
Regular nodes perform an action, like fetching data or creating an entry in a calendar. Regular nodes are named for the application they represent and are listed under Regular Nodes in the Editor UI.
Example
A Google Sheets node can be used to retrieve or write data to a Google Sheet.
Trigger nodes
Trigger nodes start workflows and supply the initial data.

Trigger nodes can be app or core nodes.
Core Trigger nodes start the workflow at a specific time, at a time interval, or on a webhook call. For example, to get all users from a Postgres database every 10 minutes, use the Interval Trigger node with the Postgres node.
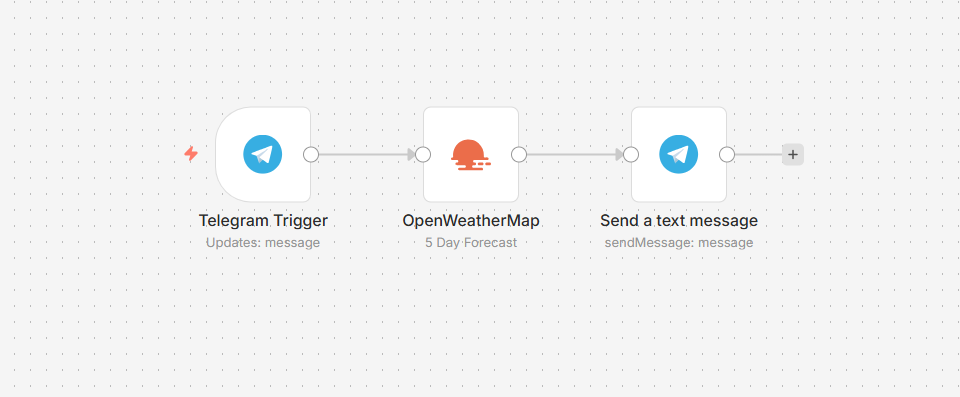
App Trigger nodes start the workflow when an event happens in an app. App Trigger nodes are named like the application they represent followed by “Trigger” and are listed under Trigger Nodes in the Editor. For example, a Telegram trigger node can be used to trigger a workflow when a message is sent in a Telegram chat.
Node settings
Nodes come with global operations and settings, as well as app-specific parameters that can be configured.
Operations
The node operations are illustrated with icons that appear on top of the node when you hover on it:
Delete: Remove the selected node from the workflow
Pause: Deactivate the selected node
Copy: Duplicate the selected node
Play: Run the selected node

To access the node parameters and settings, double-click on the node.
Parameters
The node parameters allow you to define the operations the node should perform. Find the available parameters of each node in the node reference.
Settings
The node settings allow you to configure the look and execution of the node. The following options are available:
Notes: Optional note to save with the node
Display note in flow: If active, the note above will be displayed in the workflow as a subtitle
Node Color: The color of the node in the workflow
Always Output Data: If active, the node will return an empty item even if the node returns no data during an initial execution. Be careful setting this on IF nodes, as it could cause an infinite loop.
Execute Once: If active, the node executes only once, with data from the first item it receives.
Retry On Fail: If active, the node tries to execute a failed attempt multiple times until it succeeds
Continue On Fail: If active, the workflow continues even if the execution of the node fails. When this happens, the node passes along input data from previous nodes, so the workflow should account for unexpected output data.

If a node is not correctly configured or is missing some required information, a warning sign is displayed on the top right corner of the node. To see what parameters are incorrect, double-click on the node and have a look at fields marked with red and the error message displayed in the respective warning symbol.
